
nginx-vts-exporter:
资源下载:
wget https://github.com/hnlq715/nginx-vts-exporter/releases/download/v0.10.3/nginx-vts-exporter-0.10.3.linux-amd64.tar.gz

tar -zxvf nginx-vts-exporter-0.10.3.linux-amd64.tar.gz
nginx准备工作:
1,下载vts模块包
git clone https://github.com/vozlt/nginx-module-vts.git
2,移动到指定位置:
mv nginx-module-vts ~
3,进入nginx编译目录,重新编译(需要指定vts模块文件绝对目录):
./configure --prefix=/usr/local/nginx --user=nginx --group=nginx --with-threads --with-file-aio --with-http_ssl_module --with-http_v2_module --with-http_realip_module --with-http_addition_module --with-http_xslt_module --with-http_image_filter_module --with-http_geoip_module --with-http_sub_module --with-http_dav_module --with-http_flv_module --with-http_mp4_module --with-http_gunzip_module --with-http_gzip_static_module --with-http_auth_request_module --with-http_random_index_module --with-http_secure_link_module --with-http_slice_module --with-http_stub_status_module --with-http_perl_module --with-mail --with-mail_ssl_module --with-stream --with-stream_ssl_module --with-stream_realip_module --with-stream_ssl_preread_module --with-stream_geoip_module --with-google_perftools_module --with-pcre --with-pcre-jit --with-luajit --with-cc-opt='-O2 -g -pipe -Wall -Wp,-D_FORTIFY_SOURCE=2 -fexceptions -fstack-protector-strong --param=ssp-buffer-size=4 -grecord-gcc-switches -m64 -mtune=generic -fPIC' --with-ld-opt='-Wl,-z,relro -Wl,-z,now -pie' --add-module=/root/nginx-module-vts

二进制部署的nginx需要加入模块重新编译:--add-module=/root/nginx-module-vts
docker部署的nginx需要自定义重新编译nginx镜像,把模块编译进去,这里暂不做详细赘述,后续试验后补充
2,部署操作
nginx添加配置
http新增配置:
    vhost_traffic_status_zone;
#启用共享内存区域(shared memory zone),用于存储虚拟主机(server)、上游(upstream)、过滤器(filter)等的实时流量统计信息    #必须!!!!!
    vhost_traffic_status_filter on;
#启用“过滤器”功能,允许你通过自定义标签(如 $server_name、$uri、$geoip_country_code 等变量)对流量进行分组统计。


新增server,vts专用
server {
    listen 8080;     #自定义
    server_name 127.0.0.1;   #只允许本地访问

    location /status {
       vhost_traffic_status_display;
       vhost_traffic_status_display_format json;    #json格式,给vts使用
       access_log off;
       allow 127.0.0.1;
       deny all;
        }

    location / {
        return 404;
    }
}
prometheus新增配置
  - job_name: 'nginx-vts'
    static_configs:
      - targets: ['127.0.0.1:9913']
    scrape_interval: 10s
重启服务
systemctl daemon-reload
systemctl restart prometheus
验证服务
浏览器访问promtheus
curl 127.0.0.1:9090
菜单路由:Status --> Targets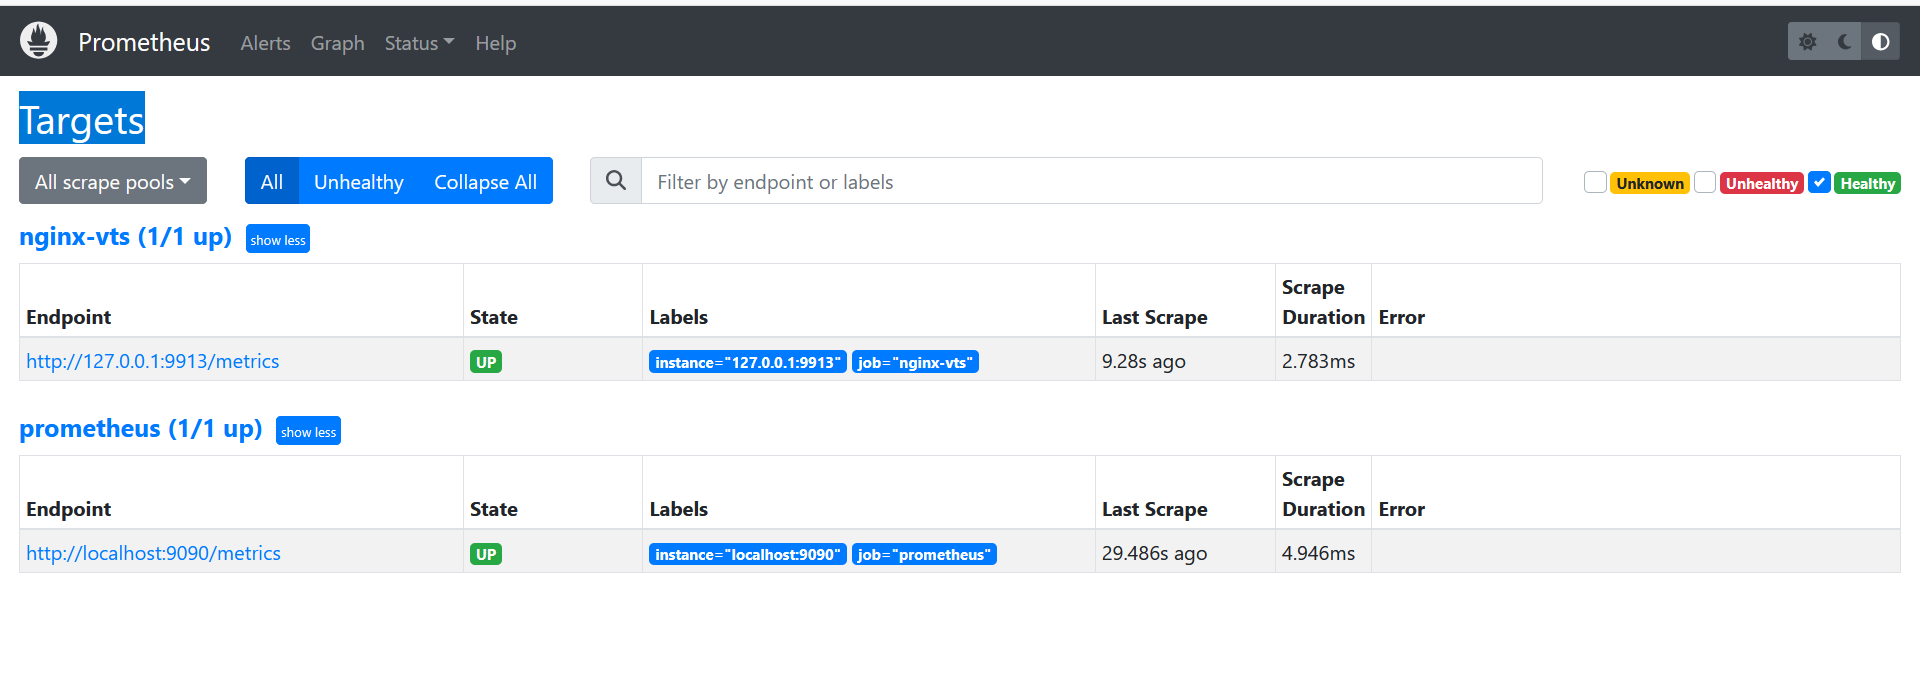
服务器访问nginx-vts-erporter
curl 127.0.0.1:9913/metrics

看到以下输出即可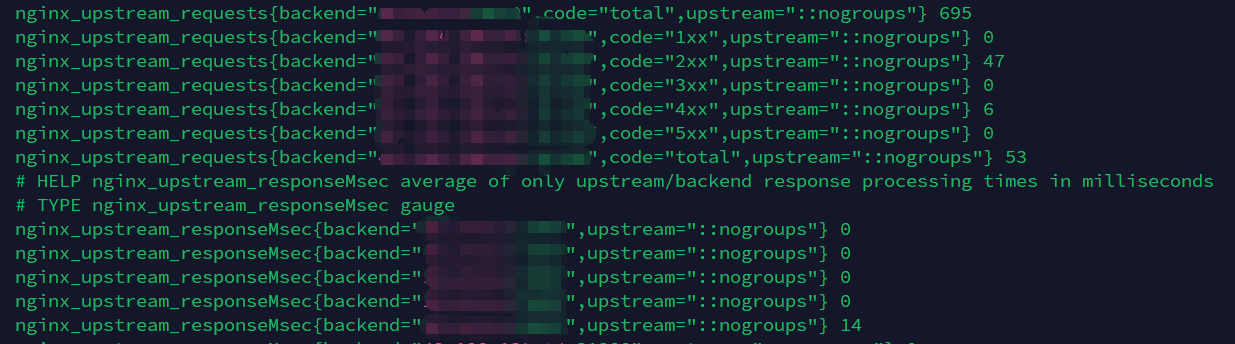
#这里有一个点,通用的grafana的模板指标都是nginx_vts*,但是网上能看到的指标都是都是nginx_*,所以只能另想他法,可以导入常规监控模板,然后说的那个修改参数,也可以生成之后手动直接导入
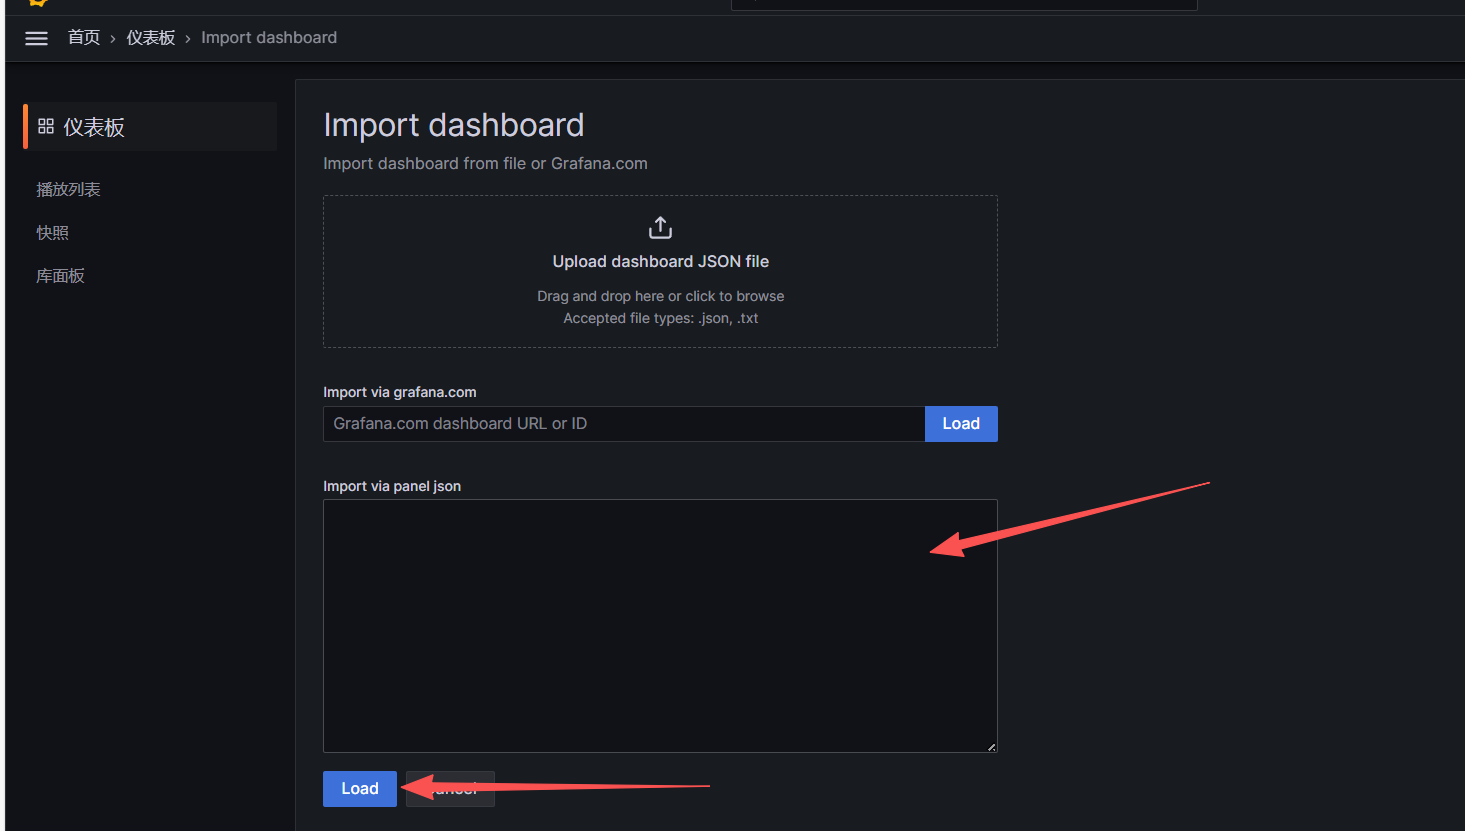
登录grafana,导入下面的监控json模板
路径:左面菜单栏 --> dashboard --> 右面的新建 --> import --> 输入json,然后load即可
{
"annotations": {
"list": [
{
"builtIn": 1,
"datasource": "-- Grafana --",
"enable": true,
"hide": true,
"iconColor": "rgba(0, 211, 255, 1)",
"name": "Annotations & Alerts",
"type": "dashboard"
},
{
"datasource": "Prometheus",
"enable": true,
"expr": "increase(nginx_server_requests{code=~\"5xx\", host!~\"_|localhost\"}[5m]) > 0",
"hide": false,
"iconColor": "rgba(255, 96, 96, 1)",
"name": "5xx错误事件",
"step": "1m",
"titleFormat": "5xx错误: {{host}}"
}
]
},
"editable": true,
"fiscalYearStartMonth": 0,
"graphTooltip": 2,
"id": 36,
"links": [],
"liveNow": false,
"panels": [
{
"collapsed": false,
"gridPos": {
"h": 1,
"w": 24,
"x": 0,
"y": 0
},
"id": 2,
"panels": [],
"title": "门户核心指标",
"type": "row"
},
{
"datasource": "Prometheus",
"fieldConfig": {
"defaults": {
"mappings": [],
"thresholds": {
"mode": "absolute",
"steps": [
{
"color": "green",
"value": null
},
{
"color": "orange",
"value": 1000
},
{
"color": "red",
"value": 5000
}
]
},
"unit": "reqps"
},
"overrides": []
},
"gridPos": {
"h": 4,
"w": 6,
"x": 0,
"y": 1
},
"id": 4,
"options": {
"colorMode": "value",
"graphMode": "sparkline",
"justifyMode": "auto",
"orientation": "horizontal",
"reduceOptions": {
"calcs": [
"last"
],
"fields": "",
"values": false
},
"showPercentChange": true,
"textMode": "auto",
"wideLayout": true
},
"pluginVersion": "10.1.5",
"targets": [
{
"expr": "sum(rate(nginx_server_requests{code=\"total\", host!~\"_|localhost\"}[5m]))",
"legendFormat": "当前QPS",
"refId": "A"
}
],
"title": "实时请求速率",
"type": "stat"
},
{
"datasource": "Prometheus",
"fieldConfig": {
"defaults": {
"mappings": [],
"thresholds": {
"mode": "absolute",
"steps": [
{
"color": "green",
"value": null
},
{
"color": "orange",
"value": 100
},
{
"color": "red",
"value": 200
}
]
}
},
"overrides": []
},
"gridPos": {
"h": 4,
"w": 6,
"x": 6,
"y": 1
},
"id": 6,
"options": {
"colorMode": "value",
"graphMode": "sparkline",
"justifyMode": "auto",
"orientation": "horizontal",
"reduceOptions": {
"calcs": [
"last"
],
"fields": "",
"values": false
},
"showPercentChange": true,
"textMode": "auto",
"wideLayout": true
},
"pluginVersion": "10.1.5",
"targets": [
{
"expr": "nginx_server_connections{status=\"active\"}",
"legendFormat": "活跃连接",
"refId": "A"
}
],
"title": "当前活跃连接",
"type": "stat"
},
{
"datasource": "Prometheus",
"fieldConfig": {
"defaults": {
"mappings": [],
"max": 1,
"min": 0,
"thresholds": {
"mode": "absolute",
"steps": [
{
"color": "green",
"value": null
},
{
"color": "orange",
"value": 5
},
{
"color": "red",
"value": 7
}
]
},
"unit": "percentunit"
},
"overrides": []
},
"gridPos": {
"h": 4,
"w": 6,
"x": 12,
"y": 1
},
"id": 8,
"options": {
"colorMode": "value",
"graphMode": "sparkline",
"justifyMode": "auto",
"orientation": "horizontal",
"reduceOptions": {
"calcs": [
"last"
],
"fields": "",
"values": false
},
"showPercentChange": true,
"textMode": "auto",
"wideLayout": true
},
"pluginVersion": "10.1.5",
"targets": [
{
"expr": "sum(rate(nginx_server_requests{code=~\"4xx|5xx\", host!~\"_|localhost\"}[5m])) / sum(rate(nginx_server_requests{code=\"total\", host!~\"_|localhost\"}[5m])) * 100",
"legendFormat": "错误率",
"refId": "A"
}
],
"title": "总错误率",
"type": "stat"
},
{
"datasource": "Prometheus",
"fieldConfig": {
"defaults": {
"mappings": [],
"thresholds": {
"mode": "absolute",
"steps": [
{
"color": "green",
"value": null
},
{
"color": "orange",
"value": 1000
},
{
"color": "red",
"value": 3000
}
]
},
"unit": "ms"
},
"overrides": []
},
"gridPos": {
"h": 4,
"w": 6,
"x": 18,
"y": 1
},
"id": 10,
"options": {
"colorMode": "value",
"graphMode": "sparkline",
"justifyMode": "auto",
"orientation": "horizontal",
"reduceOptions": {
"calcs": [
"last"
],
"fields": "",
"values": false
},
"showPercentChange": true,
"textMode": "auto",
"wideLayout": true
},
"pluginVersion": "10.1.5",
"targets": [
{
"expr": "avg(nginx_server_requestMsec{host!~\"_|localhost\"})",
"legendFormat": "平均处理时间",
"refId": "A"
}
],
"title": "请求平均处理时间",
"type": "stat"
},
{
"collapsed": false,
"gridPos": {
"h": 1,
"w": 24,
"x": 0,
"y": 5
},
"id": 12,
"panels": [],
"title": "流量与请求趋势",
"type": "row"
},
{
"aliasColors": {
"入站流量": "blue",
"出站流量": "green"
},
"bars": false,
"dashLength": 10,
"dashes": false,
"datasource": "Prometheus",
"fieldConfig": {
"defaults": {
"links": []
},
"overrides": []
},
"fill": 1,
"fillGradient": 0,
"gridPos": {
"h": 8,
"w": 24,
"x": 0,
"y": 6
},
"hiddenSeries": false,
"id": 14,
"legend": {
"avg": false,
"current": false,
"max": false,
"min": false,
"show": true,
"total": false,
"values": false
},
"lines": true,
"linewidth": 2,
"nullPointMode": "null",
"options": {
"alertThreshold": true
},
"percentage": false,
"pluginVersion": "10.1.5",
"pointradius": 2,
"points": false,
"renderer": "flot",
"seriesOverrides": [],
"spaceLength": 10,
"stack": false,
"steppedLine": false,
"targets": [
{
"expr": "sum(rate(nginx_server_bytes{direction=\"in\", host!~\"_|localhost\"}[5m])) by (direction)",
"legendFormat": "入站流量 ({{direction}})",
"refId": "A"
},
{
"expr": "sum(rate(nginx_server_bytes{direction=\"out\", host!~\"_|localhost\"}[5m])) by (direction)",
"legendFormat": "出站流量 ({{direction}})",
"refId": "B"
}
],
"thresholds": [],
"timeRegions": [],
"title": "门户总流量速率",
"tooltip": {
"mode": "multi",
"shared": true,
"sort": 0,
"value_type": "individual"
},
"type": "graph",
"xaxis": {
"mode": "time",
"show": true,
"values": []
},
"yaxes": [
{
"format": "B/s",
"label": "字节/秒",
"min": "0",
"show": true
},
{
"format": "short",
"show": false
}
],
"yaxis": {
"align": false
}
},
{
"aliasColors": {
"2xx": "green",
"3xx": "blue",
"4xx": "orange",
"5xx": "red"
},
"bars": false,
"dashLength": 10,
"dashes": false,
"datasource": "Prometheus",
"fieldConfig": {
"defaults": {
"links": []
},
"overrides": []
},
"fill": 1,
"fillGradient": 0,
"gridPos": {
"h": 8,
"w": 24,
"x": 0,
"y": 14
},
"hiddenSeries": false,
"id": 16,
"legend": {
"avg": false,
"current": false,
"max": false,
"min": false,
"show": true,
"total": false,
"values": false
},
"lines": true,
"linewidth": 2,
"nullPointMode": "null",
"options": {
"alertThreshold": true
},
"percentage": false,
"pluginVersion": "10.1.5",
"pointradius": 2,
"points": false,
"renderer": "flot",
"seriesOverrides": [],
"spaceLength": 10,
"stack": false,
"steppedLine": false,
"targets": [
{
"expr": "sum(rate(nginx_server_requests{code=~\"2xx\", host!~\"_|localhost\"}[5m])) by (code)",
"legendFormat": "{{code}}",
"refId": "A"
},
{
"expr": "sum(rate(nginx_server_requests{code=~\"3xx\", host!~\"_|localhost\"}[5m])) by (code)",
"legendFormat": "{{code}}",
"refId": "B"
},
{
"expr": "sum(rate(nginx_server_requests{code=~\"4xx\", host!~\"_|localhost\"}[5m])) by (code)",
"legendFormat": "{{code}}",
"refId": "C"
},
{
"expr": "sum(rate(nginx_server_requests{code=~\"5xx\", host!~\"_|localhost\"}[5m])) by (code)",
"legendFormat": "{{code}}",
"refId": "D"
}
],
"thresholds": [],
"timeRegions": [],
"title": "门户请求状态码趋势(堆叠)",
"tooltip": {
"mode": "multi",
"shared": true,
"sort": 0,
"value_type": "individual"
},
"type": "graph",
"xaxis": {
"mode": "time",
"show": true,
"values": []
},
"yaxes": [
{
"format": "reqps",
"label": "请求/秒",
"min": "0",
"show": true
},
{
"format": "short",
"show": false
}
],
"yaxis": {
"align": false
}
},
{
"aliasColors": {},
"bars": false,
"dashLength": 10,
"dashes": false,
"datasource": "Prometheus",
"fieldConfig": {
"defaults": {
"links": []
},
"overrides": []
},
"fill": 1,
"fillGradient": 0,
"gridPos": {
"h": 8,
"w": 12,
"x": 0,
"y": 22
},
"hiddenSeries": false,
"id": 18,
"legend": {
"avg": false,
"current": false,
"max": false,
"min": false,
"show": true,
"total": false,
"values": false
},
"lines": true,
"linewidth": 2,
"nullPointMode": "null",
"options": {
"alertThreshold": true
},
"percentage": false,
"pluginVersion": "10.1.5",
"pointradius": 2,
"points": false,
"renderer": "flot",
"seriesOverrides": [],
"spaceLength": 10,
"stack": false,
"steppedLine": false,
"targets": [
{
"expr": "nginx_server_connections{status=~\"active|reading|writing|waiting\"}",
"legendFormat": "{{status}}",
"refId": "A"
}
],
"thresholds": [],
"timeRegions": [],
"title": "门户连接状态详情",
"tooltip": {
"mode": "multi",
"shared": true,
"sort": 0,
"value_type": "individual"
},
"type": "graph",
"xaxis": {
"mode": "time",
"show": true,
"values": []
},
"yaxes": [
{
"format": "short",
"label": "连接数",
"min": "0",
"show": true
},
{
"format": "short",
"show": false
}
],
"yaxis": {
"align": false
}
},
{
"aliasColors": {},
"bars": false,
"dashLength": 10,
"dashes": false,
"datasource": "Prometheus",
"fieldConfig": {
"defaults": {
"links": []
},
"overrides": []
},
"fill": 1,
"fillGradient": 0,
"gridPos": {
"h": 8,
"w": 12,
"x": 12,
"y": 22
},
"hiddenSeries": false,
"id": 20,
"legend": {
"avg": false,
"current": false,
"max": false,
"min": false,
"show": true,
"total": false,
"values": false
},
"lines": true,
"linewidth": 2,
"nullPointMode": "null",
"options": {
"alertThreshold": true
},
"percentage": false,
"pluginVersion": "10.1.5",
"pointradius": 2,
"points": false,
"renderer": "flot",
"seriesOverrides": [],
"spaceLength": 10,
"stack": false,
"steppedLine": false,
"targets": [
{
"expr": "sum(rate(nginx_server_requests{code=\"total\", host!~\"_|localhost\"}[5m])) by (host)",
"legendFormat": "{{host}}",
"refId": "A"
}
],
"thresholds": [],
"timeRegions": [],
"title": "域名请求分布",
"tooltip": {
"mode": "multi",
"shared": true,
"sort": 0,
"value_type": "individual"
},
"type": "graph",
"xaxis": {
"mode": "time",
"show": true,
"values": []
},
"yaxes": [
{
"format": "reqps",
"label": "请求/秒",
"min": "0",
"show": true
},
{
"format": "short",
"show": false
}
],
"yaxis": {
"align": false
}
},
{
"collapsed": false,
"gridPos": {
"h": 1,
"w": 24,
"x": 0,
"y": 30
},
"id": 22,
"panels": [],
"title": "上游服务依赖监控",
"type": "row"
},
{
"aliasColors": {},
"bars": false,
"dashLength": 10,
"dashes": false,
"datasource": "Prometheus",
"fieldConfig": {
"defaults": {
"links": []
},
"overrides": []
},
"fill": 1,
"fillGradient": 0,
"gridPos": {
"h": 8,
"w": 24,
"x": 0,
"y": 31
},
"hiddenSeries": false,
"id": 24,
"legend": {
"avg": false,
"current": false,
"max": false,
"min": false,
"show": true,
"total": false,
"values": false
},
"lines": true,
"linewidth": 2,
"nullPointMode": "null",
"options": {
"alertThreshold": true
},
"percentage": false,
"pluginVersion": "10.1.5",
"pointradius": 2,
"points": false,
"renderer": "flot",
"seriesOverrides": [],
"spaceLength": 10,
"stack": false,
"steppedLine": false,
"targets": [
{
"expr": "sum(rate(nginx_upstream_requests{code=\"total\", backend!~\"10.0.0.8:3001\"}[5m])) by (backend)",
"legendFormat": "{{backend}}",
"refId": "A"
}
],
"thresholds": [],
"timeRegions": [],
"title": "上游服务请求量",
"tooltip": {
"mode": "multi",
"shared": true,
"sort": 0,
"value_type": "individual"
},
"type": "graph",
"xaxis": {
"mode": "time",
"show": true,
"values": []
},
"yaxes": [
{
"format": "reqps",
"label": "请求/秒",
"min": "0",
"show": true
},
{
"format": "short",
"show": false
}
],
"yaxis": {
"align": false
}
},
{
"aliasColors": {
"5xx错误率": "red"
},
"bars": false,
"dashLength": 10,
"dashes": false,
"datasource": "Prometheus",
"fieldConfig": {
"defaults": {
"links": []
},
"overrides": []
},
"fill": 1,
"fillGradient": 0,
"gridPos": {
"h": 8,
"w": 12,
"x": 0,
"y": 39
},
"hiddenSeries": false,
"id": 26,
"legend": {
"avg": false,
"current": false,
"max": false,
"min": false,
"show": true,
"total": false,
"values": false
},
"lines": true,
"linewidth": 2,
"nullPointMode": "null",
"options": {
"alertThreshold": true
},
"percentage": false,
"pluginVersion": "10.1.5",
"pointradius": 2,
"points": false,
"renderer": "flot",
"seriesOverrides": [],
"spaceLength": 10,
"stack": false,
"steppedLine": false,
"targets": [
{
"expr": "(sum(rate(nginx_upstream_requests{code=~\"5xx\", backend!~\"10.0.0.8:3001\"}[5m])) by (backend)) / (sum(rate(nginx_upstream_requests{code=\"total\", backend!~\"10.0.0.8:3001\"}[5m])) by (backend)) * 100",
"legendFormat": "{{backend}} 5xx错误率",
"refId": "A"
}
],
"thresholds": [
{
"colorMode": "warning",
"op": "gt",
"value": 1,
"yaxis": "left"
},
{
"colorMode": "critical",
"op": "gt",
"value": 5,
"yaxis": "left"
}
],
"timeRegions": [],
"title": "上游服务5xx错误率",
"tooltip": {
"mode": "multi",
"shared": true,
"sort": 0,
"value_type": "individual"
},
"type": "graph",
"xaxis": {
"mode": "time",
"show": true,
"values": []
},
"yaxes": [
{
"format": "percentunit",
"label": "错误率(%)",
"max": "10",
"min": "0",
"show": true
},
{
"format": "short",
"show": false
}
],
"yaxis": {
"align": false
}
},
{
"aliasColors": {
"4xx": "orange"
},
"bars": false,
"dashLength": 10,
"dashes": false,
"datasource": "Prometheus",
"fieldConfig": {
"defaults": {
"links": []
},
"overrides": []
},
"fill": 1,
"fillGradient": 0,
"gridPos": {
"h": 8,
"w": 12,
"x": 12,
"y": 39
},
"hiddenSeries": false,
"id": 44,
"legend": {
"avg": false,
"current": false,
"max": false,
"min": false,
"show": true,
"total": false,
"values": false
},
"lines": true,
"linewidth": 2,
"nullPointMode": "null",
"options": {
"alertThreshold": true
},
"percentage": false,
"pluginVersion": "10.1.5",
"pointradius": 2,
"points": false,
"renderer": "flot",
"seriesOverrides": [],
"spaceLength": 10,
"stack": false,
"steppedLine": false,
"targets": [
{
"expr": "sum(rate(nginx_upstream_requests{code=~\"4xx\", backend!~\"10.0.0.8:3001|unknown_backend\"}[5m])) by (backend)",
"legendFormat": "{{backend}} 4xx",
"refId": "A"
}
],
"thresholds": [
{
"colorMode": "warning",
"op": "gt",
"value": 5,
"yaxis": "left"
}
],
"timeRegions": [],
"title": "上游服务4xx错误速率",
"tooltip": {
"mode": "multi",
"shared": true,
"sort": 0,
"value_type": "individual"
},
"type": "graph",
"xaxis": {
"mode": "time",
"show": true,
"values": []
},
"yaxes": [
{
"format": "reqps",
"label": "请求/秒",
"min": "0",
"show": true
},
{
"format": "short",
"show": false
}
],
"yaxis": {
"align": false
}
},
{
"aliasColors": {},
"bars": false,
"dashLength": 10,
"dashes": false,
"datasource": "Prometheus",
"fieldConfig": {
"defaults": {
"links": []
},
"overrides": []
},
"fill": 1,
"fillGradient": 0,
"gridPos": {
"h": 8,
"w": 24,
"x": 0,
"y": 47
},
"hiddenSeries": false,
"id": 28,
"legend": {
"avg": false,
"current": false,
"max": false,
"min": false,
"show": true,
"total": false,
"values": false
},
"lines": true,
"linewidth": 2,
"nullPointMode": "null",
"options": {
"alertThreshold": true
},
"percentage": false,
"pluginVersion": "10.1.5",
"pointradius": 2,
"points": false,
"renderer": "flot",
"seriesOverrides": [],
"spaceLength": 10,
"stack": false,
"steppedLine": false,
"targets": [
{
"expr": "nginx_upstream_responseMsec{backend!~\"10.0.0.8:3001\"}",
"legendFormat": "{{backend}}",
"refId": "A"
}
],
"thresholds": [
{
"colorMode": "warning",
"op": "gt",
"value": 500,
"yaxis": "left"
},
{
"colorMode": "critical",
"op": "gt",
"value": 1000,
"yaxis": "left"
}
],
"timeRegions": [],
"title": "上游服务响应时间",
"tooltip": {
"mode": "multi",
"shared": true,
"sort": 0,
"value_type": "individual"
},
"type": "graph",
"xaxis": {
"mode": "time",
"show": true,
"values": []
},
"yaxes": [
{
"format": "ms",
"label": "响应时间(ms)",
"min": "0",
"show": true
},
{
"format": "short",
"show": false
}
],
"yaxis": {
"align": false
}
},
{
"collapsed": false,
"gridPos": {
"h": 1,
"w": 24,
"x": 0,
"y": 55
},
"id": 30,
"panels": [],
"title": "异常监控与告警",
"type": "row"
},
{
"aliasColors": {
"4xx": "orange"
},
"bars": false,
"dashLength": 10,
"dashes": false,
"datasource": "Prometheus",
"fieldConfig": {
"defaults": {
"links": []
},
"overrides": []
},
"fill": 1,
"fillGradient": 0,
"gridPos": {
"h": 8,
"w": 12,
"x": 0,
"y": 56
},
"hiddenSeries": false,
"id": 32,
"legend": {
"avg": false,
"current": false,
"max": false,
"min": false,
"show": true,
"total": false,
"values": false
},
"lines": true,
"linewidth": 2,
"nullPointMode": "null",
"options": {
"alertThreshold": true
},
"percentage": false,
"pluginVersion": "10.1.5",
"pointradius": 2,
"points": false,
"renderer": "flot",
"seriesOverrides": [],
"spaceLength": 10,
"stack": false,
"steppedLine": false,
"targets": [
{
"expr": "sum(rate(nginx_server_requests{code=~\"4xx\", host!~\"_|localhost\"}[5m])) by (host)",
"legendFormat": "{{host}} 4xx",
"refId": "A"
}
],
"thresholds": [
{
"colorMode": "warning",
"op": "gt",
"value": 10,
"yaxis": "left"
}
],
"timeRegions": [],
"title": "门户4xx错误分布",
"tooltip": {
"mode": "multi",
"shared": true,
"sort": 0,
"value_type": "individual"
},
"type": "graph",
"xaxis": {
"mode": "time",
"show": true,
"values": []
},
"yaxes": [
{
"format": "reqps",
"label": "请求/秒",
"min": "0",
"show": true
},
{
"format": "short",
"show": false
}
],
"yaxis": {
"align": false
}
},
{
"aliasColors": {
"5xx": "red"
},
"bars": false,
"dashLength": 10,
"dashes": false,
"datasource": "Prometheus",
"fieldConfig": {
"defaults": {
"links": []
},
"overrides": []
},
"fill": 1,
"fillGradient": 0,
"gridPos": {
"h": 8,
"w": 12,
"x": 12,
"y": 56
},
"hiddenSeries": false,
"id": 34,
"legend": {
"avg": false,
"current": false,
"max": false,
"min": false,
"show": true,
"total": false,
"values": false
},
"lines": true,
"linewidth": 2,
"nullPointMode": "null",
"options": {
"alertThreshold": true
},
"percentage": false,
"pluginVersion": "10.1.5",
"pointradius": 2,
"points": false,
"renderer": "flot",
"seriesOverrides": [],
"spaceLength": 10,
"stack": false,
"steppedLine": false,
"targets": [
{
"expr": "sum(rate(nginx_server_requests{code=~\"5xx\", host!~\"_|localhost\"}[5m])) by (host)",
"legendFormat": "{{host}} 5xx",
"refId": "A"
}
],
"thresholds": [
{
"colorMode": "critical",
"op": "gt",
"value": 0,
"yaxis": "left"
}
],
"timeRegions": [],
"title": "门户5xx错误分布",
"tooltip": {
"mode": "multi",
"shared": true,
"sort": 0,
"value_type": "individual"
},
"type": "graph",
"xaxis": {
"mode": "time",
"show": true,
"values": []
},
"yaxes": [
{
"format": "reqps",
"label": "请求/秒",
"min": "0",
"show": true
},
{
"format": "short",
"show": false
}
],
"yaxis": {
"align": false
}
},
{
"collapsed": false,
"gridPos": {
"h": 1,
"w": 24,
"x": 0,
"y": 64
},
"id": 36,
"panels": [],
"title": "Nginx服务健康",
"type": "row"
},
{
"datasource": "Prometheus",
"fieldConfig": {
"defaults": {
"mappings": [
{
"options": {
"0": {
"color": "red",
"index": 0,
"text": "异常"
},
"1": {
"color": "green",
"index": 1,
"text": "正常"
}
},
"type": "value"
}
],
"thresholds": {
"mode": "absolute",
"steps": [
{
"color": "red"
},
{
"color": "green",
"value": 1
}
]
}
},
"overrides": []
},
"gridPos": {
"h": 6,
"w": 8,
"x": 0,
"y": 65
},
"id": 38,
"options": {
"colorMode": "value",
"graphMode": "none",
"justifyMode": "auto",
"orientation": "horizontal",
"reduceOptions": {
"calcs": [
"last"
],
"fields": "",
"values": false
},
"showPercentChange": false,
"textMode": "auto",
"wideLayout": true
},
"pluginVersion": "10.1.5",
"targets": [
{
"expr": "nginx_server_info{nginxVersion=~\"1.25.*\"} > 0",
"instant": true,
"legendFormat": "服务状态",
"refId": "A"
}
],
"title": "Nginx服务状态",
"type": "stat"
},
{
"datasource": "Prometheus",
"fieldConfig": {
"defaults": {
"mappings": [],
"thresholds": {
"mode": "absolute",
"steps": [
{
"color": "green"
}
]
}
},
"overrides": []
},
"gridPos": {
"h": 6,
"w": 8,
"x": 8,
"y": 65
},
"id": 40,
"options": {
"colorMode": "value",
"graphMode": "none",
"justifyMode": "auto",
"orientation": "horizontal",
"reduceOptions": {
"calcs": [
"last"
],
"fields": "",
"values": false
},
"showPercentChange": false,
"textMode": "auto",
"wideLayout": true
},
"pluginVersion": "10.1.5",
"targets": [
{
"expr": "nginx_server_info{nginxVersion=~\"1.25.*\"}",
"format": "table",
"instant": true,
"legendFormat": "版本信息",
"refId": "A"
}
],
"title": "Nginx版本",
"type": "stat"
},
{
"datasource": "Prometheus",
"fieldConfig": {
"defaults": {
"mappings": [],
"thresholds": {
"mode": "absolute",
"steps": [
{
"color": "green"
}
]
}
},
"overrides": []
},
"gridPos": {
"h": 6,
"w": 8,
"x": 16,
"y": 65
},
"id": 42,
"options": {
"colorMode": "value",
"graphMode": "none",
"justifyMode": "auto",
"orientation": "horizontal",
"reduceOptions": {
"calcs": [
"last"
],
"fields": "",
"values": false
},
"showPercentChange": false,
"textMode": "auto",
"wideLayout": true
},
"pluginVersion": "10.1.5",
"targets": [
{
"expr": "nginx_server_connections{status=\"accepted\"}",
"instant": true,
"legendFormat": "总接受连接",
"refId": "A"
}
],
"title": "累计接受连接数",
"type": "stat"
}
],
"refresh": "5s",
"schemaVersion": 38,
"style": "dark",
"tags": [
"nginx",
"portal",
"production"
],
"templating": {
"list": []
},
"time": {
"from": "now-30m",
"to": "now"
},
"timepicker": {
"refresh_intervals": [
"5s",
"10s",
"30s",
"1m",
"5m"
],
"time_options": [
"5m",
"15m",
"1h",
"6h",
"12h",
"24h",
"7d"
]
},
"timezone": "",
"title": "Nginx门户监控面板",
"uid": "nginx-portal-monitor",
"version": 4,
"weekStart": ""
}